See how it works
Three steps from sign-up to a live chart inside your app.
1
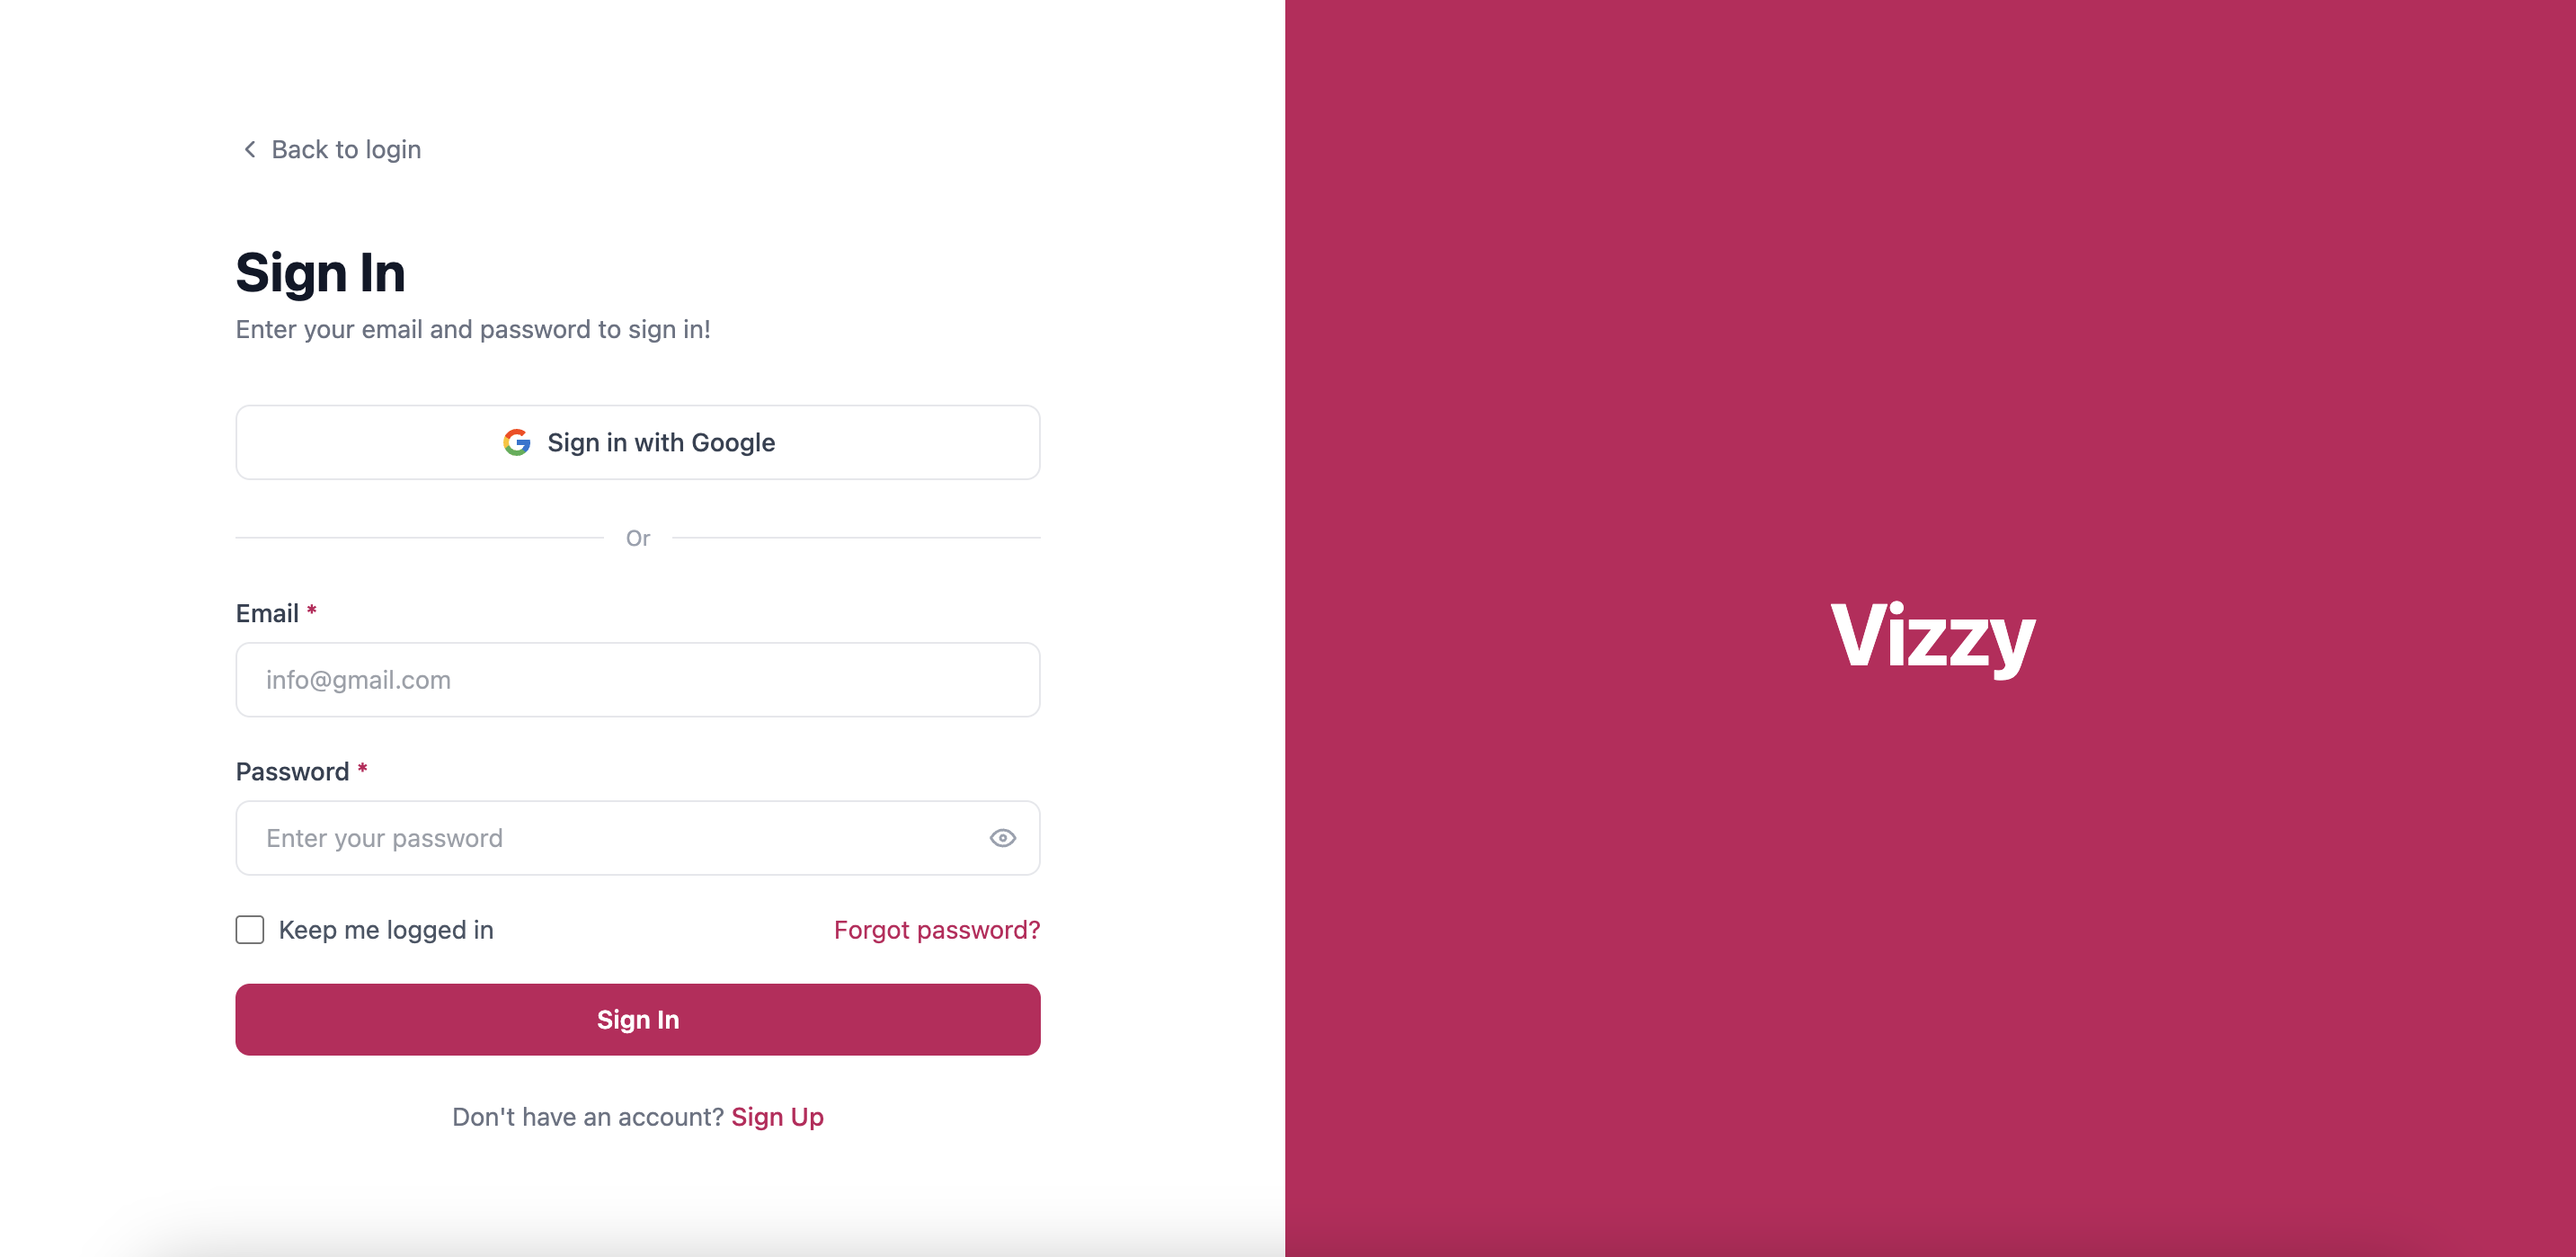
Create your free account
Sign up with Google or email in seconds. Once you're in, you get access to Vizzy's full backoffice — your private workspace for building and managing every visualization you'll ever need.
2
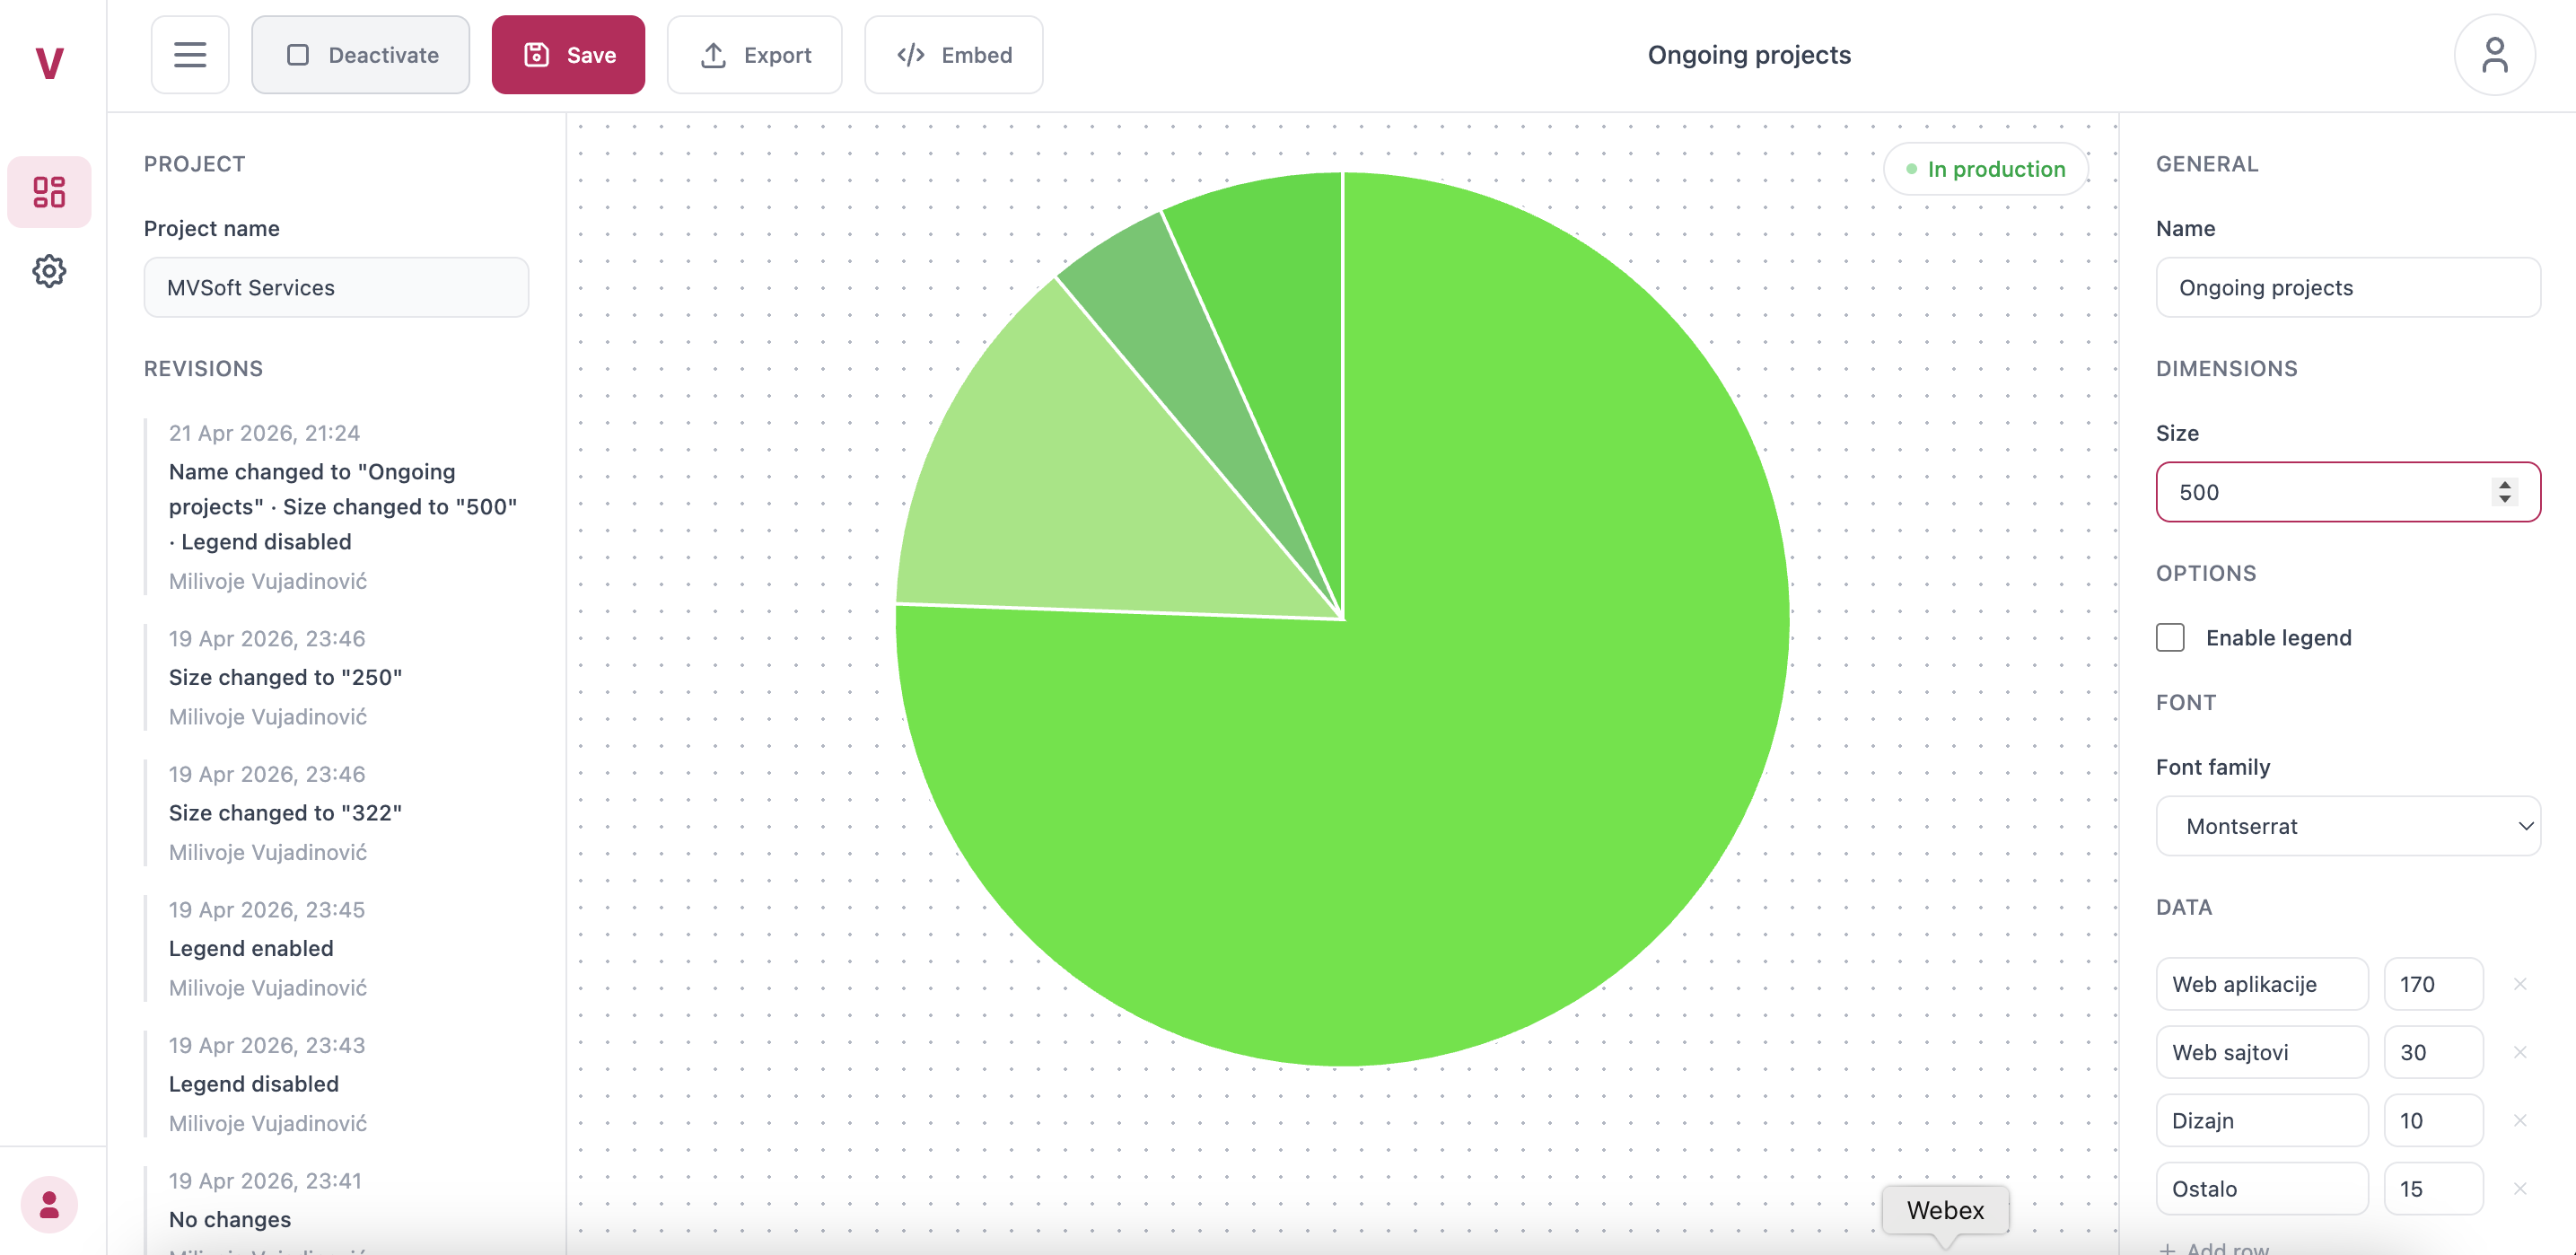
Build your visualization
Use the editor to craft any chart — pie, bar, donut, line, and more. Pick colours, set fonts, tweak dimensions, and preview every change live. All the look & feel lives here, inside Vizzy, not inside your codebase.
3
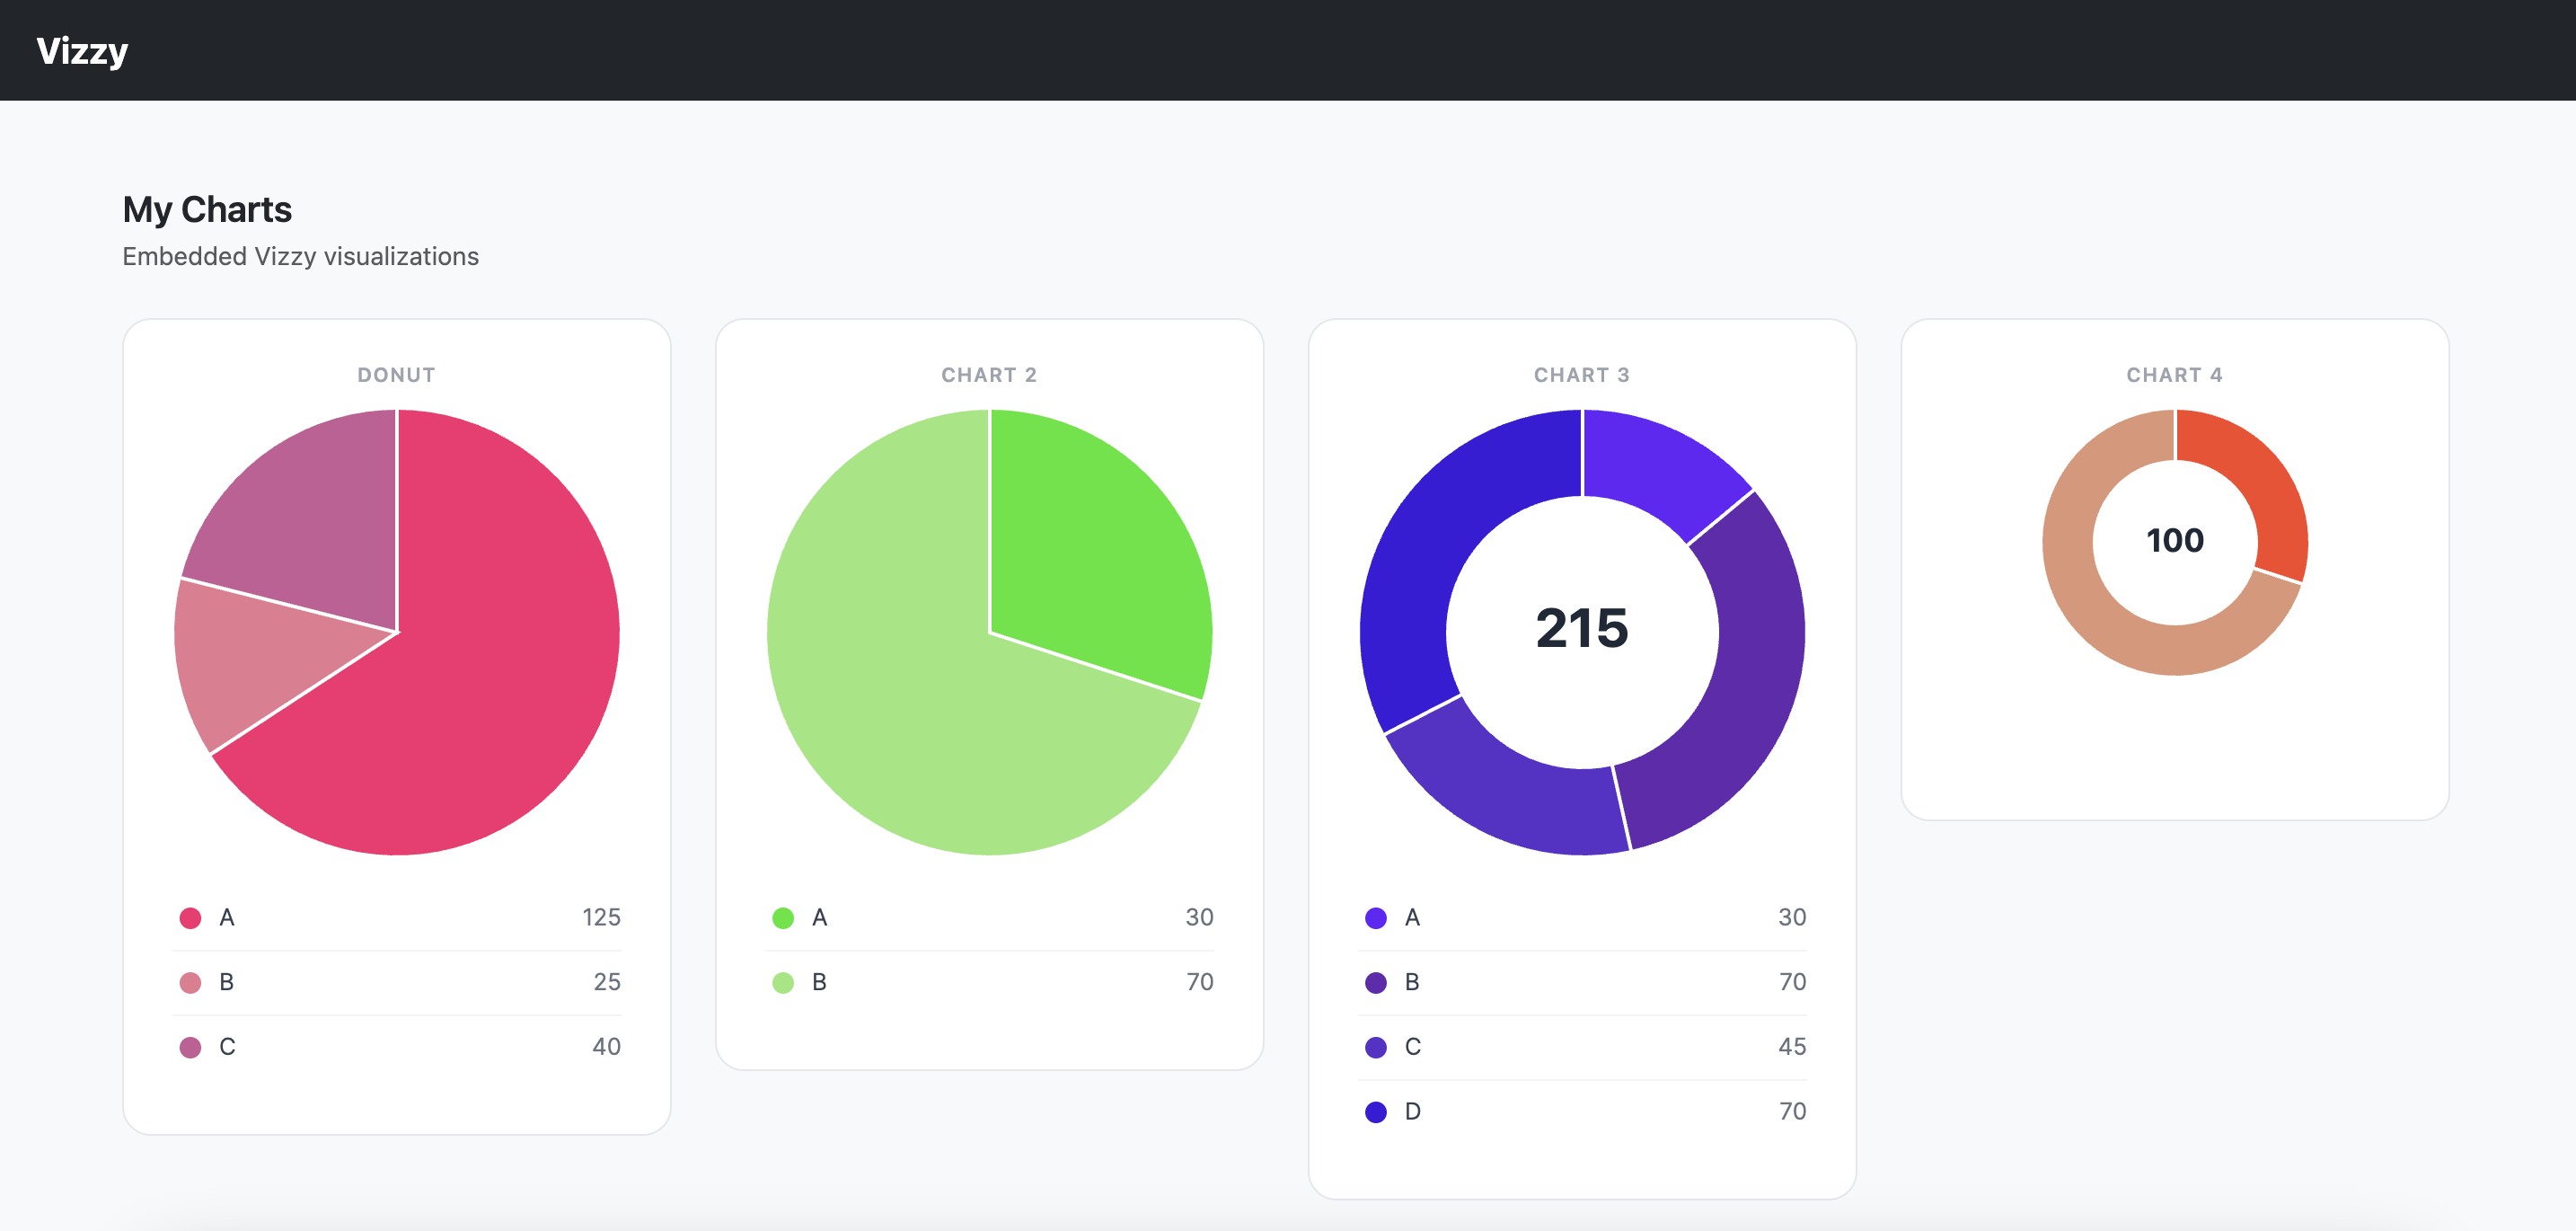
Embed in React, Angular, or any app
Copy the snippet Vizzy generates and drop it into your project. Your app just passes in the data — Vizzy takes care of rendering, styling, and updates. Works with React, Angular, Vue, or plain HTML.
React
Angular
Vue
Plain HTML